RT17 – Dr. Claire Boulangé and Oliver Lock – Digital tools for participatory transport planning
Researching Transit – Episode 17
Published: November 2020
Keywords: collaboration, participatory analytics, public engagement, visualisation, data analytics, integrated planning, public transport, co-design, innovation diffusion, smart cities, multidisciplinary, mixed-methods, health impacts, user-centred design, attention economy, planning support system, big data
Creating tools that are capable of engaging the public in the design of local transport and planning has never been more important.
In today’s show, we explore how digital tools can facilitate smarter and more collaborative planning. I spoke to Oliver Lock from the University of New South Wale’s City Analystics and Expanded Perception & Interaction Centred (EPICentre), and 2019 Smart Cities Young Smart Innovator of the year, and Dr Claire Boulangé, transport modeller at KPMG. Oliver is currently undertaking a PhD, which explores how we use data and digital tools to help the public and decision makers plan cities, otherwise known as participatory analytics. Claire completed PhD in urban planning and population health at Melbourne University. Through her research she developed the Walkability Planning Support System. In her role as transport modelling consultant, she continues to explore the synergies between transport and health.
The term Planning Support System is often used to collectively describe tools that support planners. These tools have evolved from paper-based to digital maps to immersive visualisations. New tools go beyond description (what’s there?) to diagnosis (why is it there?) to prediction (what happens if it is there?). Decision making can leverage these tools to help prescribe what is needed and where, to achieve societal goals. Smart, digital tools combine traditional information about individual preferences and new forms of passive data about how people move around, with the existing information we have about the city.
Recent technological innovations have expanded the accessibility of a range of tools available for research and practice, including:
- Digital mapping products: google maps and Google Earth have changed how everyone plans cities
- Open data and data standards,
- Planning-side:
- general transit feed specification (GTFS) – development of replicable, real time tools for transit agencies the world over.
- Remix
- Survey-based map-tools (Maptionnaire)
- Research
- Data analysis: R, python
- Visualisation, spatial collaboration – Carto, Geodesign hub
- Planning-side:
Mobility patterns are changing, and they are also diverse. Increasing the efficiency of public transport relies on being able to understand what will make people travel differently. It is also increasingly important to factor in individual preferences to our transport solutions; and to do so by asking people. These digital tools make that process of engagement more replicable, scalable and therefore transcend existing barriers. Greater availability of training material for tools which were once niche; has set the scene for upskilling in these domains.
Claire discusses the walkability planning support tool which enables planners to test the impact of different land use planning scenarios on walking. Claire worked collaboratively with the Metropolitan Planning Authority to help them understand what’s being measured and how. The interactive map tool helped planners understand infrastructure needs and healthcare cost of developing in a new neighbourhood with limited walkability area, compared to redeveloping an existing (brownfield) site. The development of the Walkability Planning Support System required considerable time and resources. Yet this stakeholder journey is an invaluable part of introducing new technologies and ultimately achieving good project outcomes.
What are the keys to successful digital and participatory tools for planning?
Our discussion unpacks many different ways that technology and data sources can improve planning. Four particular lessons emerge for developing successful tools.
First, there is a fine balance between the capabilities of digital tools, and the flexibility of the model. One key to developing a model that facilitates successful planning appraisal in real-time is a specific prediction policy problem.
“You’re trying to create a problem that a model can solve, and to do that, you need to come up with very specific parameters”. – Oli
Another is involving the end-users in the development of the planning support system. When designing the Walkability Planning Support System, Claire leveraged Roger’s innovation diffusion framework (2) to identify the characteristics needed to achieve widespread adoption of the tool, as well as to understand.
The interactions modelled by planning support systems can be complex – such as the influence of the built environment on travel choices. In Claire’s experience, a third factor for success is a simple and structured approach that allows people time to reflect and understand the interactions they are observing.
“We can go very quickly to the very complicated model, but when it comes to engagement you probably need to scale it back” – Claire
Finally, ensuring a mix of stakeholders from different disciplines are at the (map) table is also key.
“It starts in transport research and then you realise that you need to include all these other disciplines to get this transport outcome” – Oliver
To strikes a balance between complexity, simplicity and engagement, Oliver suggests tool developers ensure that:
- People are informed by it and data is able to be accessed and used for new purposes (informative)
- It is attractive to use and interactive to use (engaging)
- It is designed to provide information that in a format that is readily applied to answer the planning problem at hand (useful)
- Using the tool prompts discussion between multiple users reflecting the whole of society, in a way that can influence the outcome (participatory)
What do practitioners need to consider if they want to lift their team’s capability to implement digital and participatory tools for planning?
Claire suggests that developing a level of data literacy is key. Some foundational skills can enable a team to manage and implement more sophisticated tools that really leverage the wealth of information that has become available. This include:
- understanding different datasets
- identifying the markers of data quality
- devising replicable analysis procedures
Combining data skills with spatial analysis capabilities and an understanding of public health can unlock holistic solutions for transport and land use planning that improve economic and physical wellbeing.
At what stage of planning decision-making should participatory analytics be leveraged?
Oliver’s research focuses on understanding the different participation and data requirements of different tools at different stages of planning decision-making
- Operational, quick decision-making: Difficult to engage people in these decision, requires streamlined and automated decision support tools
- Local planning, small neighbourhood changes: limited public interest in begin engaged, requires more engaging ways of garnering public participation
- Long-term planning: robust data and models, significant involvement needed
Oli’s thesis combined case studies at each level of decision making. The operational case study explored whether tweets were a useful data source to inform public transport planning decisions. Using natural language processing, the research explored sentiment, tone and topics, and the relationship of these to the actual performance of the public transport network. Oliver also explored unchartered territory – asking the tweeters whether they felt their tweets were an accurate reflection of their sentiment. Most respondents said they would prefer to be engaged in a more active way (3). The research highlighted the role of passive, smart-city data sources as complimentary rather than stand-alone tools for public engagement.
Using the example of the Australian Urban Observatory’s interactive liveability scorecards, Claire remarks that monitoring planning outcomes over time is also critical (4).
In closing our conversation, Oliver and Claire suggests that COVID-19 presents an opportunity to reset our expectations and assumptions about what we want from our planning systems.
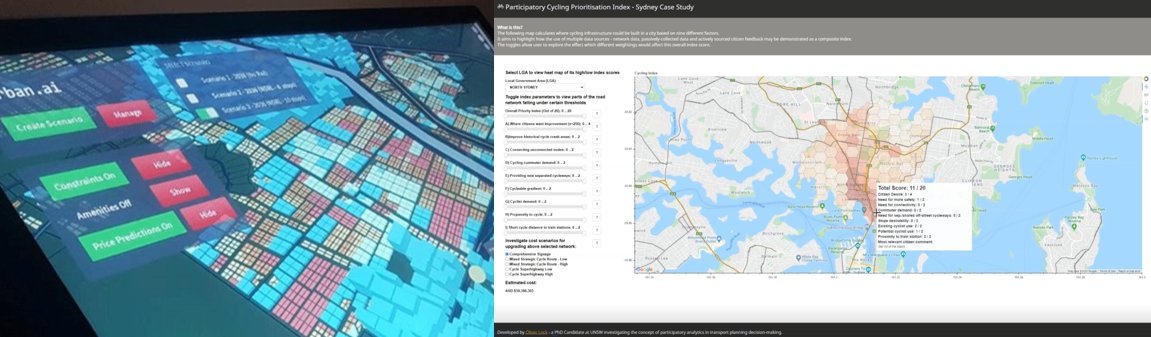 Example of city dashboard interfaces (source: Oliver Lock)
 Making the planning process collaborative with interactive map tables (source: Oliver Lock)
Notes
(1) Read about the Walkability Planning Support System: Boulangé, C., Pettit, C., & Giles-Corti, B. (2017). The Walkability Planning Support System: An Evidence-Based Tool to Design Healthy Communities. In S. Geertman, A. Allan, C. Pettit, & J. Stillwell (Eds.), Planning Support Science for Smarter Urban Futures (pp. 153-165). Springer International Publishing. https://doi.org/10.1007/978-3-319-57819-4_
(2) Rogers, E. M., & Rogers, E. M. (2003). Diffusion of innovations (5th ed. ed.). New York : Free Press
(3) Findings from Oliver’s participatory analytics case studies are available online:
- Operational: Lock, O., & Pettit, C. (2020). Social media as passive geo-participation in transportation planning – how effective are topic modeling & sentiment analysis in comparison with citizen surveys? Geo-Spatial Information Science, 1-18. https://doi.org/10.1080/10095020.2020.1815596
- Local: Lock, O. (2020). Cycling Behaviour Changes as a Result of COVID-19: A Survey of Users in Sydney, Australia. Findings, June. https://doi.org/https://doi.org/10.32866/001c.13405
- Strategic: Lock, O.,Bain, M., Pettit, C. (2020). Towards the collaborative development and use of Machine Learning techniques in Planning Support Systems – a Sydney example. Environment and Planning B: Urban Analytics & City Science. SAGE Publishing
- General: Lock, O., Leao, S., Bednarz, T. and Pettit, C. (2019). A review and reframing of participatory urban dashboards. City, Culture and Society.
Visit the Australian Urban Observatory’s Liveability scorecard’s, including interactive portal: https://auo.org.au/about/
Finally, to get started with interactive map interfaces, Claire and Oliver recommend Kepler and Maptionnaire . While Kepler can help with simple , shareable and open-source visualisations which can take big datasets well beyond normal software suites, Maptionnaire was a psychologist’s exploration of place-based participation.
Sign up for updates when we release new Researching Transit episodes: http://eepurl.com/g9tCdb
Music from this episode is from https://www.purple-planet.com
- Date November 8, 2020
- Tags Podcast