Objectives
- To develop a multi-criteria report card for assessing the performance of public transport passenger information websites
- To assess selected websites in key cities using the report card to assess their relative performance and areas for improvement
- To track changes in website performance between 2008 and 2013.
Method
- Literature review to identify good practice design elements of public transport passenger information websites
- Development of report card containing 50 weighted criteria to benchmark public transport passenger information websites
- Benchmarking of public transport passenger information websites in 9 world cities in both 2008 and 2013.
Key results
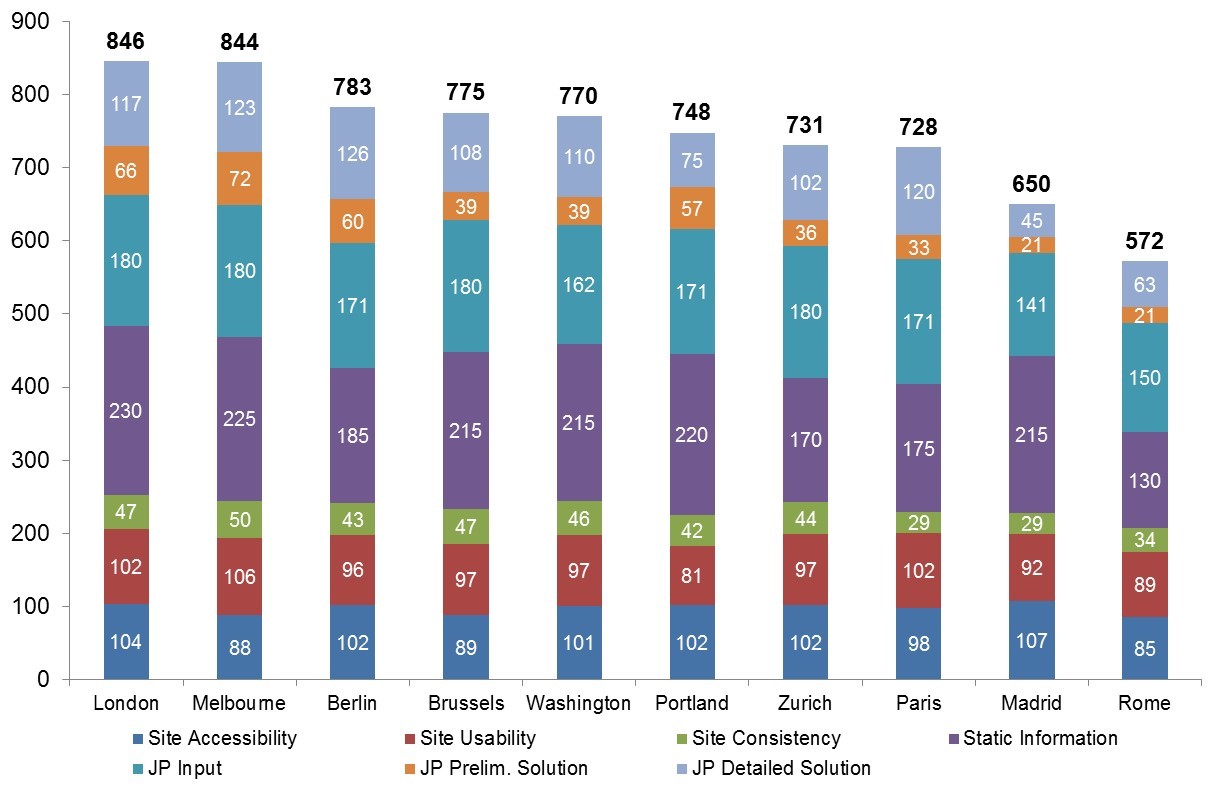
London and Melbourne had the highest performance in both 2008 and 2013.
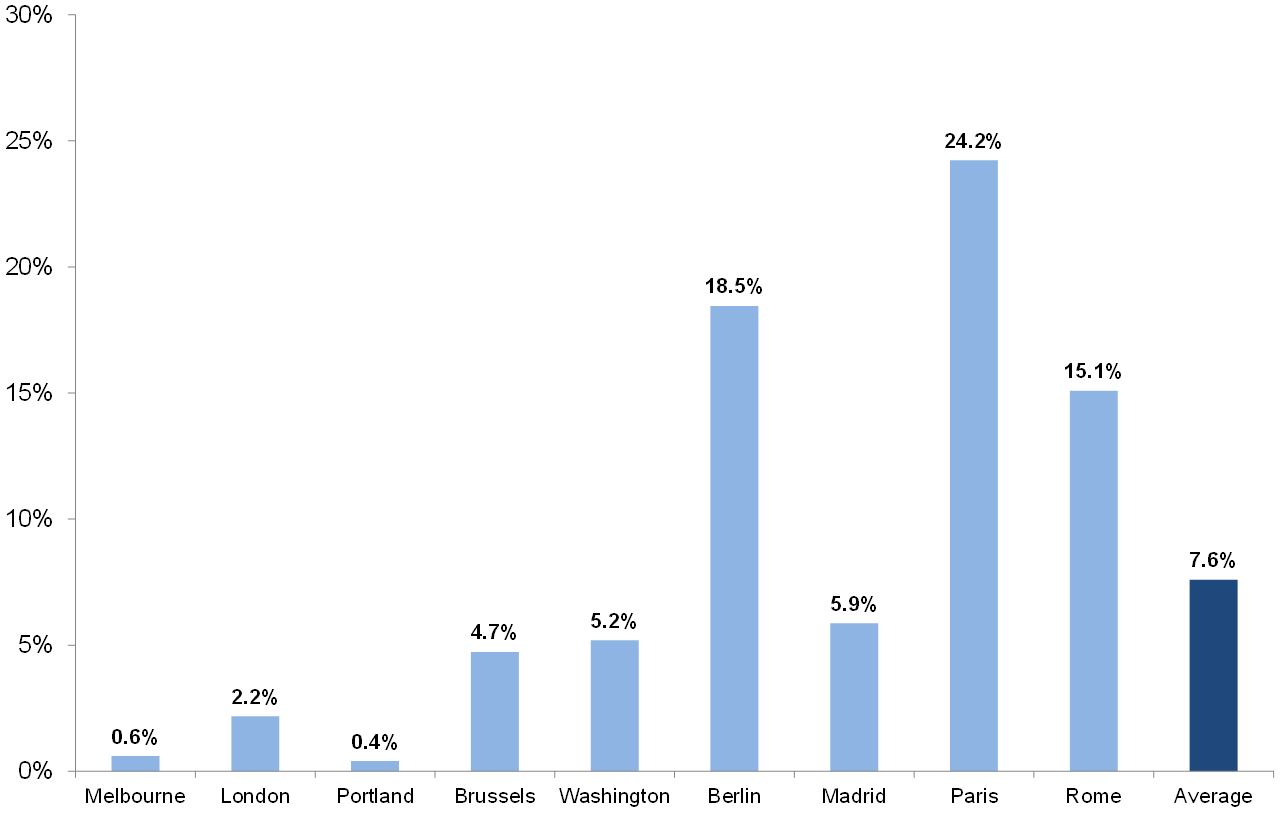
- Average benchmark scores improved by 7.6% across all cities between 2008 and 2013
- The largest improvement between 2008 and 2013 was achieved by Paris (24%) due to enhanced website usability, and improved static information and journey planner output design
- Rome scored lowest overall, however it demonstrated a 15% improvement between 2008 and 2013 including better static information and journey planner input design
- While the 2013 scores demonstrate improvement there is still room for better design in even the best websites such as London and Melbourne
- Results help to identify areas of good performance and gaps in how public transport websites are designed.
Research Papers
Currie, G. & Gook, M. (2009) Measuring the Performance of Transit Passenger Information Websites. Transportation Research Record: Journal of the Transportation Research Board, No. 2110, pp. 137-148.
Currie, G. & De Gruyter, C. (2014) Benchmarking Trends in Transit Passenger Information Website Design Performance – An International Study. Presented at the 93rd Transportation Research Board (TRB) Annual Meeting, Washington, D.C., United States.


