Objectives
- To measure aggregate urban public transport provision in Melbourne from 2001-02 to 2017-18
- To explore if and how urban public transport provision has kept pace with population growth.
Method
- Compilation of public transport vehicle kilometres (by mode) and urban population data for Melbourne by year
- Comparison of public transport vehicle kilometres per capita by year.
Key results
Public transport service provision per capita has been declining since 2011-12 in Melbourne.
Fig. 1 Public transport timetabled kilometres per year by mode in Melbourne (indexed: 2001-02 = 100)
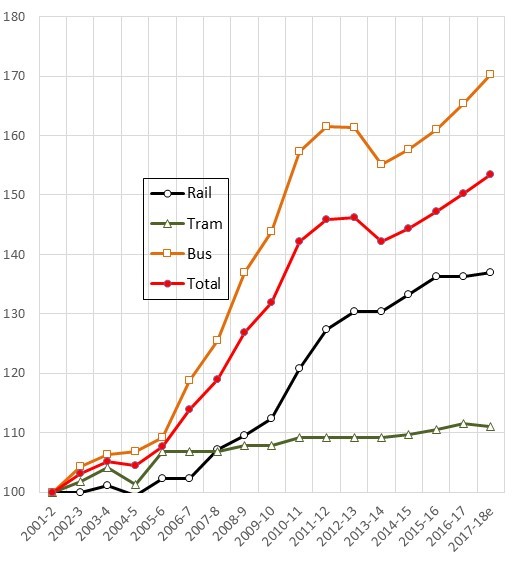
Data sources: Public Transport Victoria & Victorian Department of Transport Annual Reports, Victorian Parliament Budget Papers.
Fig. 2 Public transport timetabled kilometres per capita per year in Melbourne
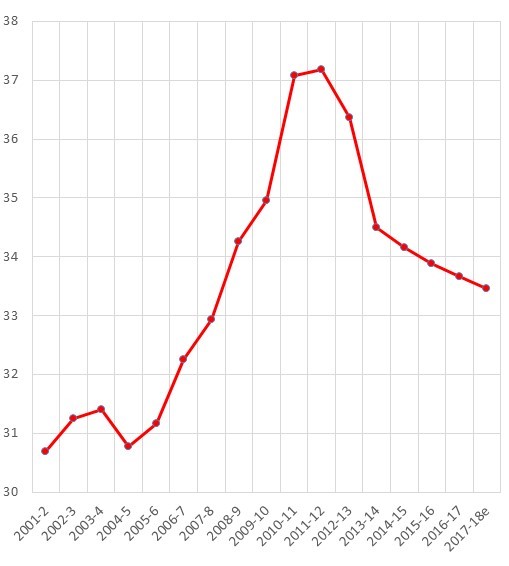
Data sources: Public Transport Victoria & Victorian Department of Transport Annual Reports, Victorian Parliament Budget Papers, Australian Bureau of Statistics.
- Total urban public transport service provision in Melbourne increased by 50% since 2001-02, although bus service provision recorded a decline in 2013-14
- Melbourne experienced a net increase in public transport service provision per capita between 2001-02 and 2017-18; however, this has been declining since 2011-12
- Monitoring public transport service levels per capita over time provides a useful way of determining whether public transport provision is keeping pace with population growth.
Presentations
Currie, G. (2016) Melbourne Transport Problems & Progress – Ideas for Bold Politicians, presented to Academy of Technology, Science and Engineering (ATSE), Parliamentary Briefing, Melbourne, October 2016.
Currie, G. (2017) Melbourne Buses, Performance, Progress and Futures, presented to Eastern Transport Coalition, October Meeting, City of Whitehorse, October 2017.